今日は、グラフの説明の仕方です。まずは穴埋め問題から。
(A) Look at the graph and read the paragraphs below it about the unemployment rate in Japan. Fill in the blank spaces (1)-(5) with the most appropriate words from the list (A)-(J) on the next page. Write the correct letters on your answer sheet. No word should be used more than once.
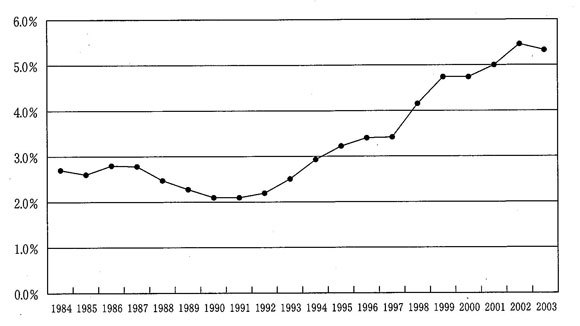
Unemployment Rate in Japan
(source: Web Japan Gateway for All Japanese Information at http://web-japan.org/stat/index.html)
The graph indicates that from the early 1990s, it became more and more difficult for people to find jobs in Japan. Unemployment was at its ( 1 ) in 1990 and 1991: around 2.1 percent. Since then, however, it rose ( 2 ). In fact, the unemployment rate in 2002 was more than double that of 1990.
Unemployment may have begun ( 3 ) as a direct result of Japan's economic bubble bursting nearly fifteen years ago. In addition, these days many young people want to have more free time and are not interested in looking for jobs. In 2003, the economy in Japan seemed to be getting better, so perhaps that is why the unemployment rate dropped. However, some people ( 4 ) that if the economy does not continue to ( 5 ),by the year 2010 more than 10 percent of the Japanese population could be out of work.
(A) highest (B) lowest (C) get worse (D) believe (E) rising (F) considerably
(G) improve (H) hope (I) occasionally (J) falling

コメント